

Turning Factory Data into Carbon Performance Insight
Across our client’s global production facilities, the operational maturity at the site level is impressive, and decarbonization is treated as a core operational priority.
Real-time meters feed intelligent building systems. Control room dashboards track load and performance. Teams have visibility into consumption and efficiency. At the local level, factories run smoothly.
But zoom out across five global production sites, and the challenge becomes one of scale. Before this initiative, each facility operated largely as its own island.
Energy and emissions data resided in disconnected local systems. There was no shared data model, no standardized collection framework, and no consistent way to ask a question across facilities and receive a comparable answer.
At the same time, the company’s climate ambition was bold with goals of reducing their carbon footprint 37% by 2032 and reaching net-zero emissions by 2050.
Achieving those targets would require enterprise-wide carbon transparency across operations, the supply chain, and the product lifecycle. This case study details how SoftServe helped a global toy manufacturer design and build a carbon accounting platform to make that possible.
Climate Commitments and Reality
The climate strategy team recognized that they needed to assess current capabilities and design a scalable path forward. They looked for a partner who could combine advisory depth, technical expertise, and implementation experience, so they selected SoftServe to lead the transformation.
SoftServe led a structured initiative to assess the organization’s carbon data landscape, design a scalable data foundation, and define a phased roadmap that would guide the client’s future implementation efforts.
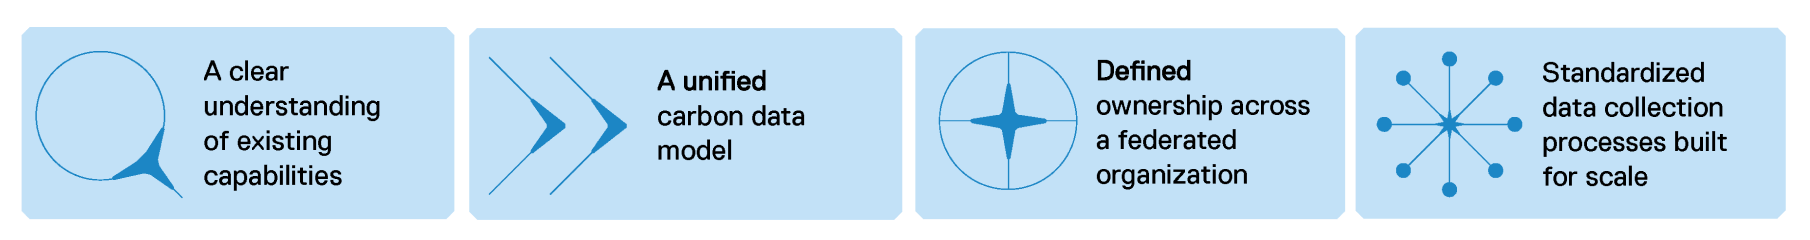
Delivering the vision of a carbon accounting platform required getting the data fundamentals right from the outset:
Aligning the Enterprise
During three intensive on-site workshops, SoftServe brought together cross-functional leaders from sustainability, operations, engineering, data, and digital to assess the current state and define the blueprint for enterprise-wide carbon accounting. The objectives were to:
- Clarify business drivers and success criteria
- Assess the current GHG data landscape
- Understand factory-level constraints and opportunities
- Align technology direction with climate strategy
- Prioritize high-value use cases and quick wins
- Define the future carbon accounting delivery model
3-Day Workshop at a Glance
| Day | Leaders Involved | Focus | Key Decisions |
|---|---|---|---|
| 01 | Climate Strategy, Sustainability, Reporting, Operations | Define the case for change | Confirmed climate commitments outpaced the data foundation. Selected factories as the starting domain. |
| 02 | Energy leadership, Engineering, Data, Digital | Assess the current-state landscape | Identified governance gaps, fragmented systems, and lack of a harmonized carbon data model. |
| 03 | Cross-functional leadership | Design what’s next | Defined maturity levels, prioritized quick wins, and established a phased roadmap. |
The Structural Gaps Exposed
By the end of the workshop discussions, it was clear that the organization’s climate ambition was outpacing its underlying data foundation. The infrastructure needed to support enterprise-wide carbon intelligence was not yet aligned.
The team identified several structural gaps.
Key Structural Gaps
| Theme | What We Observed | Why It Mattered |
|---|---|---|
| Distributed Data Environment | Carbon data lived across factory systems, building platforms, spreadsheets, and supplier inputs. KPI definitions varied across teams. | There was no single source of truth. Reconciliation was manual, and scaling would amplify inconsistency and risk. |
| Granularity Gaps | Energy and emissions data was often aggregated, infrequently updated, or manually uploaded. Metering capabilities varied by site. | Operational teams could not reliably model reduction scenarios or connect emissions to productivity and cost levers. |
| Scope 3 Complexity | The majority of emissions sat outside direct operations, primarily in upstream activities. | Factory efficiency alone would not materially reduce the total footprint. A value chain data strategy was essential. |
| Built for Reporting, Not Decisions | Systems were designed for periodic compliance reporting rather than operational decision support. | Leadership needed forecasting and modeling. Operations needed near-real-time insight. Carbon had to evolve into a business metric. |
Why Factories Became the Starting Point
While the long-term vision extended across the enterprise, factories were selected as the proving ground.
The workshops made it clear that factory operations offered the right starting point. They combined measurable emissions, operational control, and existing digital infrastructure, making them ideal for validating the broader carbon intelligence architecture.
The ultimate vision for factories extends beyond energy monitoring to include:
- Digital twins to monitor performance and simulate operational changes
- Operational analytics to identify emissions hotspots
- Forecasting models for energy consumption
- Energy intensity benchmarking, such as MWh per tonne of product
- Scenario analysis to answer practical questions like, “What would it take to reduce emissions at this site by X percent?”
- Modeling the cost and energy impact of reduction initiatives

Training and Evaluation on Three Datasets
The insights gathered during the on-site workshops were synthesized into a clear picture of how carbon data flowed across the organization, where it worked, where it broke down, and where it needed to evolve.
That work resulted in three foundational outputs.
- Initial Framing of the Engagement. A clear articulation of objectives, scope, and success criteria. This document aligned every team on what the program was trying to achieve and how success would be measured.
- As-Is Technology Landscape. A mapped view of systems, data flows, ownership structures, and gaps across every facility and functional team. For the first time, the organization had a single document that showed a full picture of how carbon data moved across the enterprise.
- Proposed Carbon Accounting Delivery Model. A structured roadmap outlining how GHG inventory, analytics, governance, and tooling should evolve through to full enterprise scale.
Defining the Architecture for the Carbon Intelligence Platform
The vision for the centralized carbon accounting tool was for it to be a scalable, iterative platform that could:
- Aggregate carbon data across domains and value chain stages
- Automate emissions calculations at the most granular level available
- Translate long-term climate targets into short-term carbon budgets
- Track reduction levers across business units
- Provide transparency from enterprise totals down to activity-level emissions
1. GHG Inventory
The first priority was stabilizing the fundamentals. A unified carbon data model would serve as the control center of the system. This required:
- Standardized carbon data layers from enterprise totals to activity-level utility data
- A centralized emission factor catalog
- Automated emissions calculations aligned with the GHG Protocol
- Defined governance around data ownership and updates
- Integration with factory meters, operational systems, supplier inputs, and group platforms
2. GHG Analytics
With the inventory foundation defined, the focus shifted to analysis. The platform was envisioned as a dynamic analytics layer capable of:
- Emissions trajectory tracking against targets
- Carbon budgeting visibility across domains
- Hotspot identification at factory, process, and activity levels
- Forecasting and scenario modeling
- Automated footprint reporting
Role-based dashboards would support sustainability leaders, operations teams, and executives alike by enabling drill-down views into data while maintaining enterprise visibility.
3. Carbon Intelligence
The longer-term ambition extended beyond measurement and reporting. Carbon data needed to connect directly to business levers, including:
- Energy productivity metrics such as energy per tonne
- Cost optimization decisions
- Renewable integration strategies
- Supplier emissions benchmarking
- Evaluation of reduction initiatives
What the Carbon Platform Enables at the Factory Level
With the foundational architecture in place, the platform provides factory-level carbon intelligence across reporting, performance management, and operational decision-making.
External Reporting
Automated Reporting
- Centralized dashboard consolidating emissions data across all facilities
- Automated emissions factors database replacing manual inputs
- Consistent GHG reporting aligned to SBTi and GHG Protocol standards
GHG Reduction Lever Evaluation
- Identify high-emissions areas by process and activity
- Model what-if scenarios for site-level reduction targets
- Recommend energy reduction projects by value chain step
Internal Reporting
Management Reporting
- Carbon budget tracking against emission reduction goals at facility level
- Aggregated energy savings reporting across reduction initiatives
- Historical benchmarking and trend analysis by site and process area
Partner and Supplier Assessment
- Benchmark facilities by energy intensity and spend
- Assess suppliers based on emissions reduction initiatives
- Connect procurement decisions to carbon outcomes
Decision Making
Forecasting and Carbon Budgeting
- Dynamic energy consumption forecasting by facility and functional area
- Scenario modeling to evaluate reduction options and trade-offs
- Carbon-aware recommendations tied to productivity and cost outcomes
Emissions Hotspot Tracking
- Monitor moulding machines, HVAC, chillers, and air compressors
- Track energy use by functional area: moulding, processing, packing
- Measure performance in MWh per tonne of product
Research, Design, and Prototype
With the architecture defined and the roadmap aligned, the program moved into Research, Design, and Prototype. This is an 8-to-10-week sprint designed by SoftServe to reduce uncertainty before a single line of production code is committed.
Rather than move straight into build, the team ran three coordinated tracks in parallel:
- Foundation
- Understanding the full business and technical landscape.
- Defining the solution architecture.
- Aligning stakeholders around scope and ownership.
- Data Model
- Mapping carbon data at the most granular level possible.
- Designing and beginning construction of the initial Carbon Data Model.
- Insights
- Identifying and prioritizing the first management and factory reports.
- Designing and validating dashboards with end users before development began.
Each model and report moved through the same three stages:

By the end of the workshop and prototype phase:
- The architecture vision was validated
- Data contracts were reviewed
- The first reports were conceptually designed with their future users

SoftServe approaches complex transformation programs this way to eliminate uncertainty early so delivery can move quickly and confidently through the project.
Following the workshop and prototype phase, SoftServe delivered the architectural vision, carbon data model framework, and the initial roadmap for the carbon accounting platform.
The client then had the roadmap they needed to move forward with the implementation independently.
The Carbon Accounting Platform Today
SoftServe’s cross-functional workshops, architecture design, and prototype development helped align stakeholders and define the roadmap for the carbon accounting platform. With the architectural blueprint in place, the organization’s Carbon Analytics team began implementing the platform internally.
The team built a centralized carbon data platform on Databricks to ingest and standardize energy and emissions data across global manufacturing sites. Previously fragmented data sources are now being consolidated into a structured environment supported by harmonized data models and standardized ingestion processes.
Building on that momentum, the team is now developing a web application that will allow the Climate Strategy group to manage emission factor values, map them to operational data, and calculate CO₂ emissions across facilities.
As the platform begins to take shape, its impact across the organization is already becoming visible:
- Carbon data is being mapped end-to-end, bringing greater clarity to ownership and data flows.
- Standardized KPIs and harmonized data models are replacing fragmented reporting approaches.
- Manual compilation is declining as emissions calculations become more consistent and repeatable.
- Factory leaders have improved visibility into energy use and emissions hotspots.
- Sustainability teams have a clearer view of carbon budgets and progress against enterprise targets.