

The Data Architecture Behind Smarter Automotive Paint Booths
Painting cars inside a vehicle manufacturing plant is essentially its own mini-operation and one of the most energy-intensive, tightly controlled, and operationally complex parts of the entire production line.
Once the vehicle's body is assembled, it moves through a long sequence of pre-treatment, cleaning, primer, base coat, clear coat, and multiple rounds of drying and curing. Every stage demands massive volumes of conditioned air while keeping temperature and humidity locked inside a narrow process window.
It’s no surprise, then, that the paint shop is usually the single biggest energy consumer in vehicle manufacturing, using 30% to 75% of a plant’s total energy (ScienceDirect, 2024).
For our client, a major automotive manufacturer, the challenge was even tougher because their booths rely on a large amount of fresh air intake, making them extremely sensitive to weather changes. When outside conditions shifted, the booth would react late … then over-respond … then correct again, burning far more heating and cooling energy than necessary.
Our client knew that if you’re aiming for significant savings, the paint booth is the smartest place to start, so they turned to SoftServe for a solution.
We proposed using AI and a digital twin to automate how the paint booth responds to changing conditions, taking the process from reactive to predictive.
But to make that possible, we had to start with the basics: cleaning and organizing the data. Once the data foundation was solid, we could build the machine-learning models and create a digital twin that accurately reflected how the booth behaves in real life.
Here’s how we did it
The goal was to build a simulation model of the paint booth so we could safely test AI-driven ventilation control and understand its true impact on energy use. To make that possible, SoftServe structured the work around two coordinated streams:
- Artificial intelligence stream
Develop a simulator that accurately reflects real paint-booth behavior, then use AI agents to control temperature, humidity, and airflow within that virtual environment. This allowed the team to test, refine, and validate control strategies before applying them to live equipment.
- Data, scaling, and integration stream
Establish the data pipelines, infrastructure, and automation needed to feed the models, run simulations, migrate workloads, and ultimately integrate AI-driven control with the client’s Azure-based systems.
Both streams hinged on one critical requirement: clean, unified data.
Without it, the AI couldn’t learn, the simulation wouldn’t behave like the real booth, and energy-saving results wouldn’t be reliable or measurable.

An AI and digital twin project … but first, we had to fix the data
SoftServe was originally asked to build Power BI dashboards on top of the plant’s historical and streaming data. It sounded straightforward until we took a closer look. The customer had tons of raw streaming data, but almost none of it was actually usable.
Before we could even think about dashboards or building a digital twin, we had to create the entire data foundation: model the tables, clean the streams, and design a structure that reflected how the booth behaved in real life.
And here’s why that mattered so much:
Before this project, the plant had no historical dataset suitable for machine learning; none of the clean, time-aligned, high-resolution data was needed to train an AI model that can predict or optimize booth behavior. Without that foundation, the manufacturer couldn’t tap into AI at all.
At the time, you couldn’t open a single view and see:
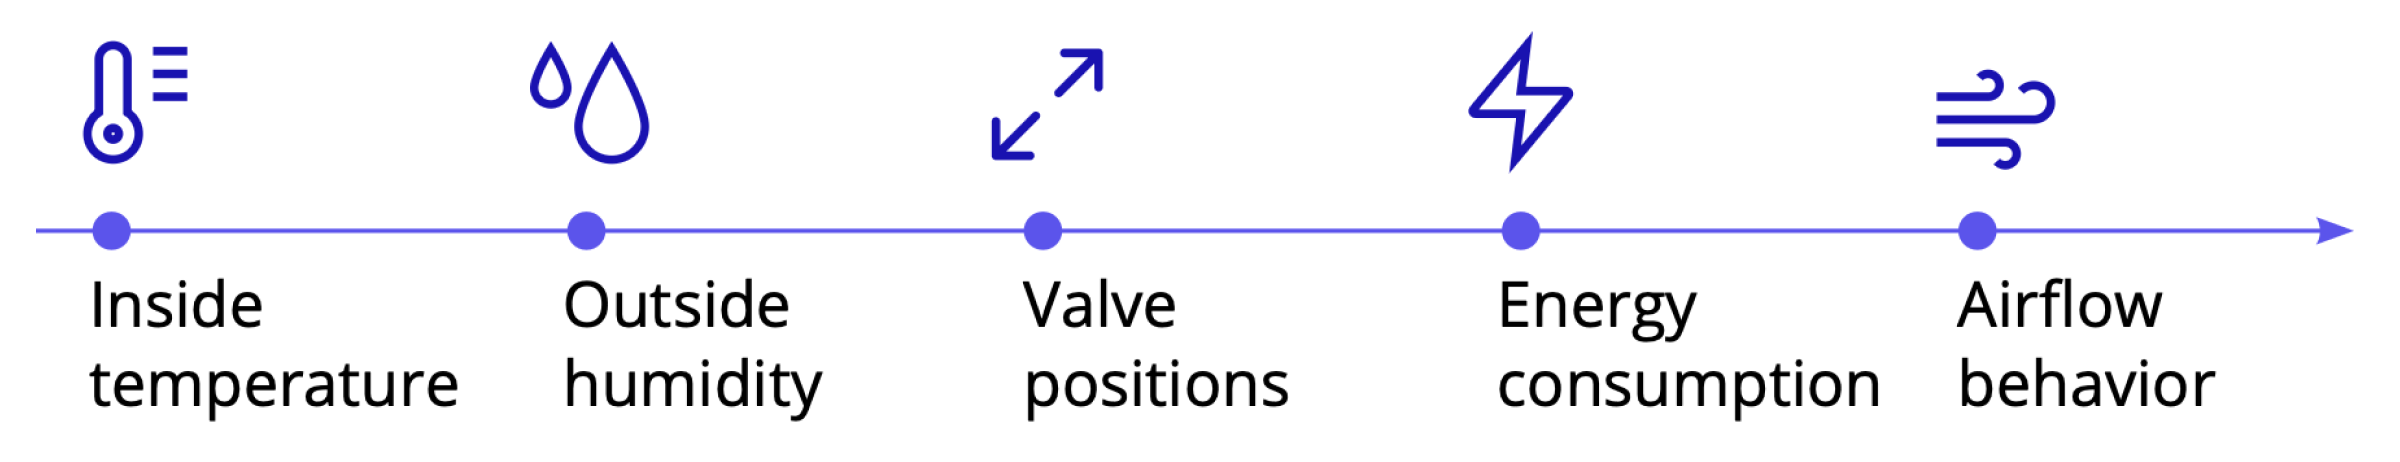
… all lined up on one timeline.
And without that, it was impossible to understand what was actually causing instability inside the booth.
To make any of this possible, we needed to start where every successful AI project begins.
Building the data foundation
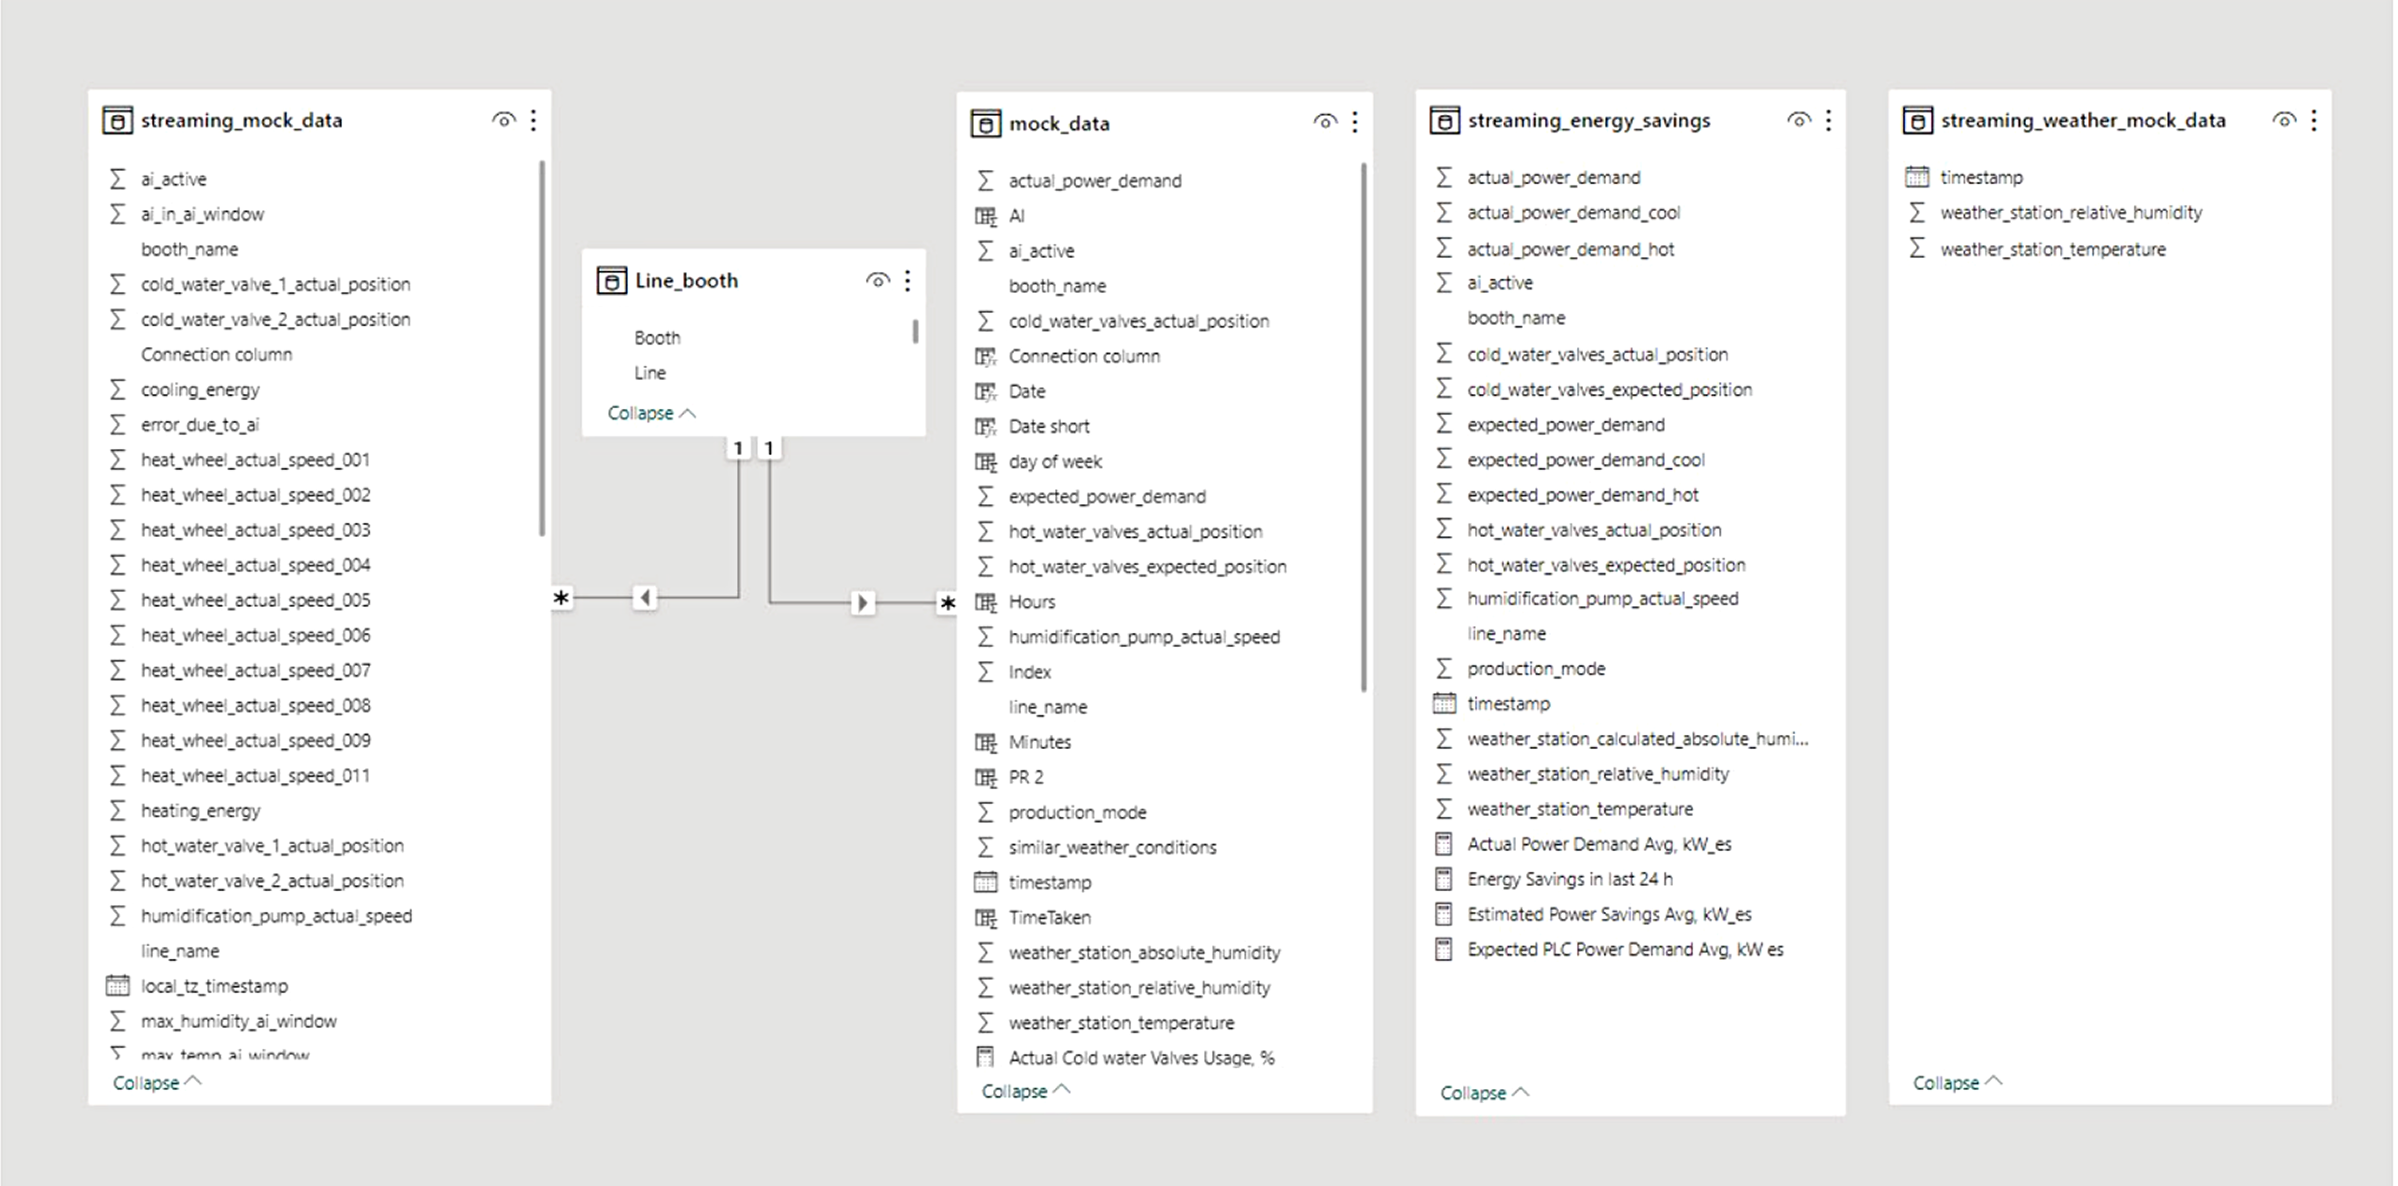
We’ve included the data model here as a reference point. What follows are the key steps we took to organize the data and prepare the analytics needed to support both the AI model and the digital twin.

Creating the data model (from zero to something usable)
The team started by defining the core tables and relationships needed to represent paint-booth behavior. This included:
- Operational telemetry (streaming_mock_data, mock_data)
- Weather inputs (streaming_weather_mock_data)
- Energy consumption and savings (streaming_energy_savings)
- Lookup tables and configuration models
You can see this structure laid out in the project’s data diagram.
Bringing streaming telemetry into one unified view
To make the simulation model possible, SoftServe needed all incoming signals, like internal booth metrics, external weather data, and energy measurements, to speak the same language.
That meant unifying:
- Timestamps
- Sampling rates
- Naming conventions
- Booth/line identifiers
- Units of measurement
The final model shows this clearly: all three telemetry streams feed into structured tables that match a single schema.
Cleaning, aligning, and preparing time-series data
The raw signals were captured at different intervals and sometimes with missing or lagged values (which is common in industrial systems). For the simulation dashboard to behave like the real booth, the data had to be:
- Cleaned
- Synchronized
- Normalized
- Mapped to the correct booth and line
- Aligned along a shared timeline
The high-resolution telemetry tables in the data model make it clear that extensive data cleaning and synchronization were completed before any simulation work could begin.
Building the simulation-ready dataset
Once telemetry streams were brought into a single structure, the team could finally use them to drive the simulation model.
The simulation model required:
- Continuous, aligned time-series inputs
- Realistic behavioral relationships between signals
- Stable patterns that represent the booth’s real dynamics
This is why the data foundation mattered so much. It was the enabler for the simulation dashboard and the AI controller.
Preparing the dataset for machine learning
The project didn’t initially have the kind of historical dataset needed to train an AI model. But once the structured data model was built, SoftServe could use telemetry patterns to:
- Identify how the booth reacted to internal and external conditions
- Correlate energy use with airflow settings and environment
- Understand how different components behaved under load
This prepared the ground for the AI agent that would later recommend and eventually automate optimal ventilation settings.
The solution
Once we finally had clean, unified data flowing, the first thing the client saw was the Power BI dashboard. This became the control center for everything:
- Daily, weekly, and per-booth energy savings
- Actual vs. expected power usage
- Temperature and humidity stability
- Ramp-up times
- Real-time equipment behavior (valves, heat wheels, pumps)
- AI corrections and out-of-window events
Then the agents arrived
With the data foundation in place, SoftServe introduced an AI agent that could actually control the booth.
The model understood:
- Temperature and humidity trends
- Airflow dynamics
- Valve positions and heat wheel speeds
- How all of that translated into energy use
And instead of reacting late (like the old system), the agent predicted what the booth would need and adjusted settings proactively.
Of course, you don’t just let an AI loose in a live paint booth.
So SoftServe built a digital twin dashboard of the booth where every airflow change, humidity spike, and valve adjustment could be tested safely.
In the simulator, the team ran dozens of scenarios:
- Different weather conditions
- Different airflow or temperature setpoints
- Rapid environmental changes
- How equipment behaved under load
This is where the team validated model decisions and made sure the agent behaved safely and predictably before ever touching production equipment.
A real-time IoT pipeline to close the loop
Once validated, the agent was connected to the real booth through a production-grade, Azure-hosted IoT pipeline.
This pipeline:
- Streamed telemetry from every sensor
- Fed live conditions into the model
- Applied recommended setpoints
- Checked all decisions against safety rules
- Logged everything for audit and traceability
This created a true closed-loop system where data insights, action, and verification all happened automatically.
One of the biggest wins?
The solution didn’t require ripping out legacy systems.
SoftServe integrated directly with:
- The plant’s PLC logic
- Existing safety systems
- Their Azure environment
- Operational dashboards
A smarter paint booth, powered by AI, built on the data foundation we created, without rebuilding the entire infrastructure.
With clean, unified data powering the AI and digital twin, the operational improvements started to show up almost immediately.

Faster Ramp-Ups
Ramp-up time dropped from 40 minutes to ~10, which meant smoother shift transitions and far fewer production delays.

Zero Process Window Violations
The AI kept temperature and humidity perfectly dialed in eliminating out-of-window events and the wasted recovery energy that used to follow them.

A Reliable AI Partner
A fully production-ready AI controller that learned from real conditions and supported operators in real time.

Built for Scale
Because the data foundation, digital twin, and AI pipeline were built to be modular, the solution can be:
- Rolled out to additional paint booths,
- Applied to other ventilation-heavy processes, and
- Extended into plant-wide energy optimization.
These improvements alone changed how the booth ran day-to-day. But the real impact shows up when you look at energy savings.
Meaningful Energy Savings Where It Mattered Most
Earlier, we mentioned a study that showed that in vehicle manufacturing, the paint shop can consume 30% to 75% of an entire plant’s energy.
That’s why the results of this project were transformational.
The AI-driven control system delivered approximately a 20% reduction in paint-booth energy consumption. And when you apply that to the paint shop’s share of the total plant load, the impact becomes very real, very fast.
For example, here’s what that means in practice:
- If a plant uses 100 units of total energy, the paint shop alone uses 30–75 units.
- A 20% reduction in that slice translates to 6–15 units saved overall.
- That’s essentially taking 6% to 15% of the entire factory’s energy footprint off the table just from optimizing the paint booths.
This is why the project mattered: