

Digging Into the Details: Using Data to Access Your Energy Use Dynamics
You need to uncover energy inefficiencies before remedying them. That’s why granular monitoring is the first step to effective energy management.
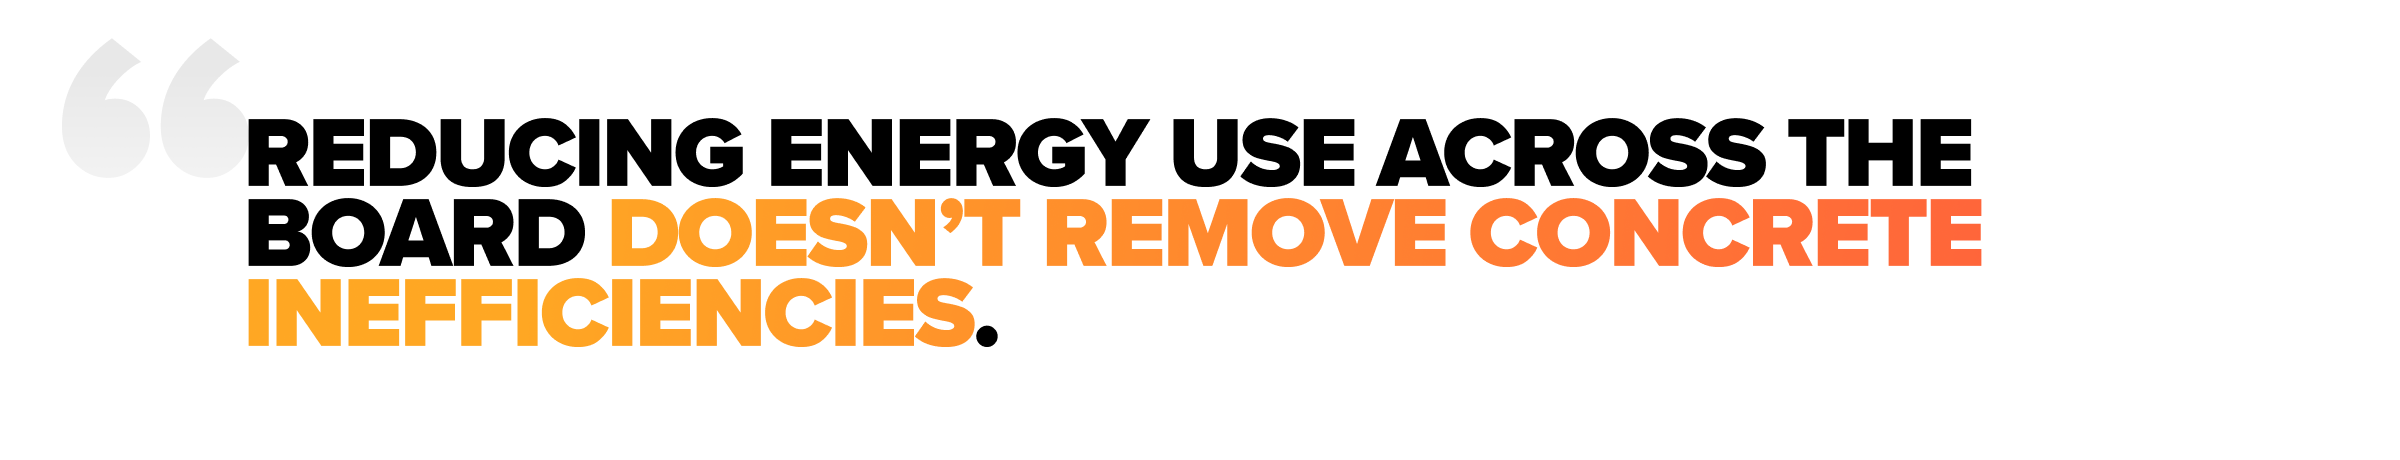
Energy prices are skyrocketing and it’s more pressing than ever to identify inefficiencies. While many companies have a general idea of their energy consumption, high-level monitoring only gives you limited insight. To truly understand your energy use, you need detailed visibility into its dynamics. That entails monitoring the many factors that contribute to your energy consumption, which quickly results in a massive flow of time-dependent information from disparate sources. How do you implement the infrastructure to integrate those multiple data streams while maintaining the high granularity needed for robust visibility?
You need a centralized data platform capable of ingesting all your energy data. By developing that data foundation, you take the first step to analyzing the root causes of your energy use — giving you the power to move toward energy efficiency.

Going granular on the grid
The problem of shallow monitoring became clear to the New York State Energy Research and Development Authority (NYSERDA) as it sought to make non-residential buildings in New York City more energy-efficient, occupant-responsive, and grid-interactive. To this end, it needed to move beyond building performance methods.
Current methods for building performance evaluation rely on static evaluations. To provide an accurate picture of a building’s energy efficiency, you need hourly measured building data in building performance assessment methods.
To understand why, consider the case of two hypothetical office buildings operating from 7:00 a.m. to 11:00 p.m. Each has a floor area of one million square feet and uses the same amount of energy. Based on Energy Star’s static evaluation they are considered equally energy efficient.
Yet, building A has 40% occupancy in single-occupancy offices whereas building B’s hot-desking program enabled it to reach 90% capacity, meaning that each occupant uses less energy. Moreover, A uses a centralized mechanical, electrical, and plumbing (MEP) system around the clock, while B features solar panels and thermal energy storage infrastructure for peak load savings, making it dynamically responsive to weather shifts and less carbon-intensive.
Clearly, building A is inefficient compared with building B. The challenge facing the NYSERDA was to create a fine-grained image of the extent and drivers of that inefficiency.
IoT sensorization for in-depth monitoring
If you only have access to your aggregate energy use — frozen in time and isolated from your infrastructure — you’re missing out on actionable insights. Energy use is tied to crucial aspects of your operations. Energy management begins with capturing usage while keeping things moving smoothly.
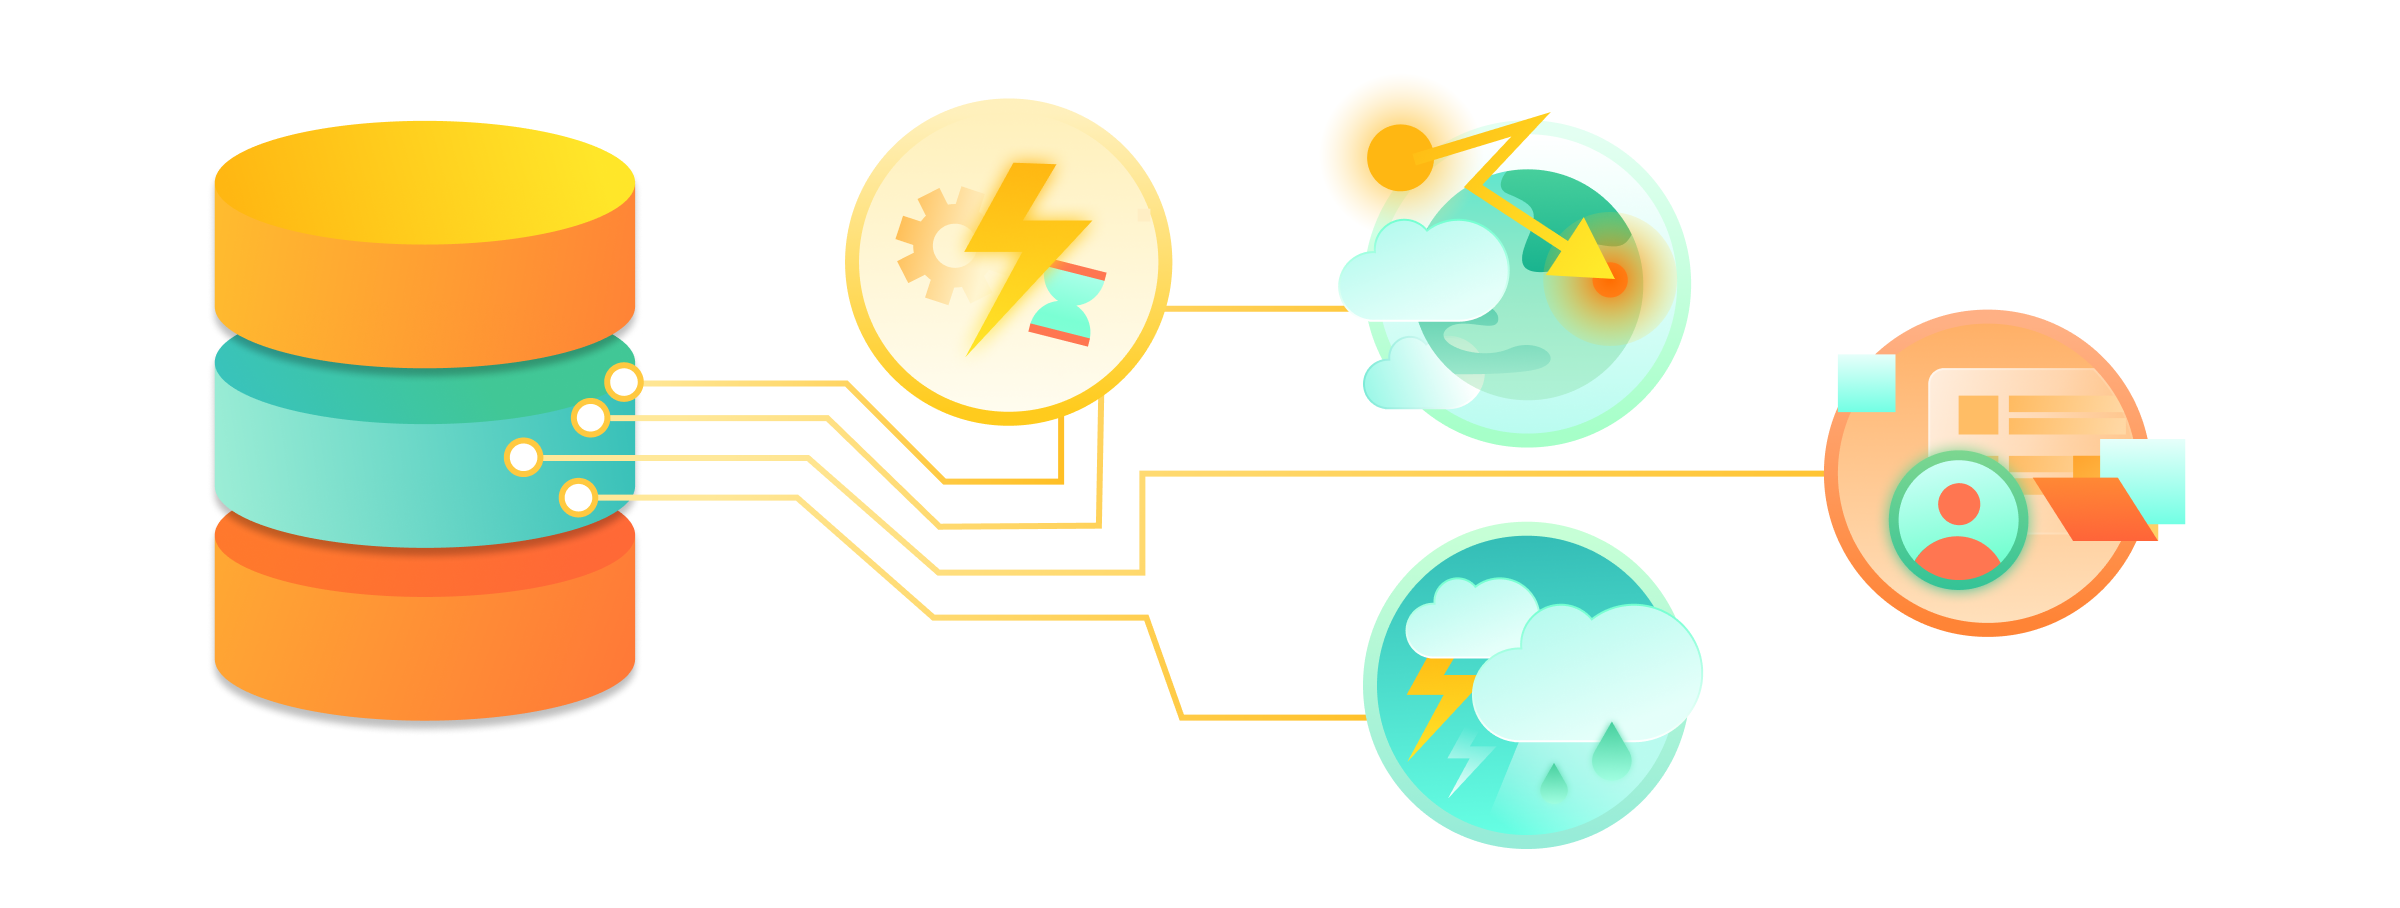
For that, you must collect dynamic performance data from operational components via sensors integrated into an IoT platform. And to relate the data gathered by those IoT devices to your energy use, you need to aggregate the streams into a centralized database.
Centralized data ingestion, in turn, begins by developing a cloud architecture, database schemas, and authentication procedures to securely unify your data streams. In a second step, you must prepare those streams for normalization and select databases for relational and time series data.
And once you have integrated your IoT data streams into your data platform, you can delve into understanding how your energy consumption relates to your operation — and where there is room for improvement.
From monitoring to benchmarking
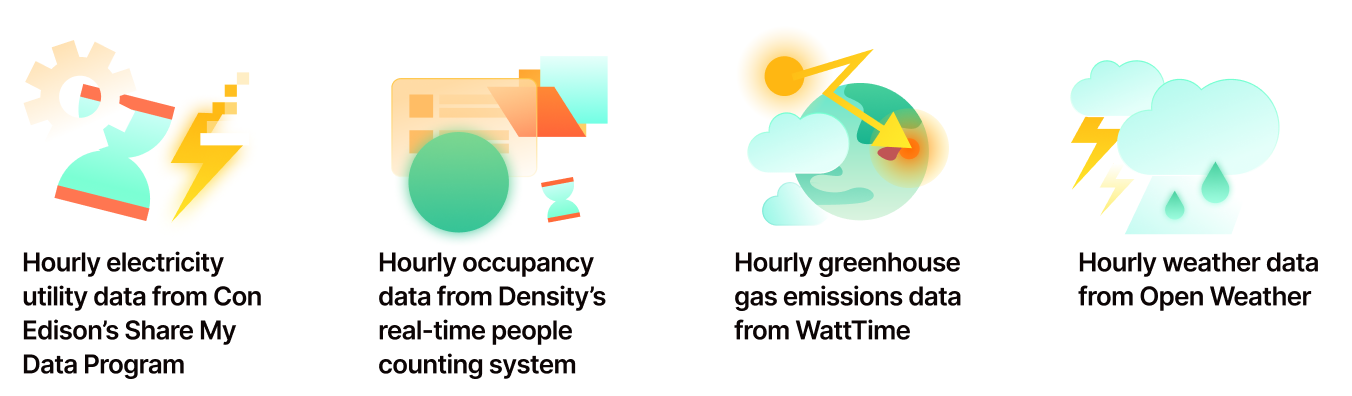
That’s what NYSERDA needed to complete its project. It tapped MEP specialist Jaros, Baum & Bolles (JB&B) to lead the effort and SoftServe to develop a PoC cloud platform to prove that it was possible to use hourly data on diverse factors to evaluate buildings’ energy use and performance. Hosted on Google Cloud, NYSERDA piloted a real estate energy benchmarking platform for ten buildings by integrating monitoring from:
With that monitoring infrastructure, NYSERDA was able to show the time-relational data for building’s energy efficiency. That’s the first step to identifying critical relationships between building use and energy consumption that can be used to make future buildings energy-efficient, occupant-responsive, and grid-interactive.
The condition of successful energy management
Whatever your long-term strategy is — like deploying digital twins to simulate and predict energy use — there is no better way to kick off your energy management journey than with a cloud-based data foundation. You can then tie diverse data streams together and develop a comprehensive understanding of your energy use.
If you want to learn more about how SoftServe can help you through each stage of your energy management journey, check out this article. And if you want to get started on your own data-driven energy monitoring project, let’s talk.